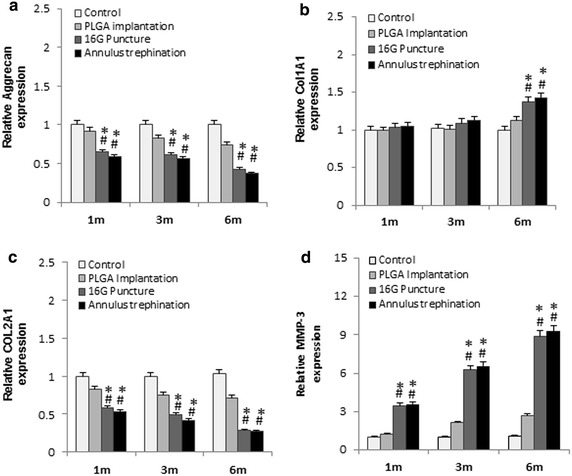
Fig. 9.

mRNA expression of aggrecan, Col1A1, Col2A1, MMP-3, at 1, 3, 6 months after surgery. The graph showed a marked reduction in aggrecan (a), Col2A1 (c), and significant increase in Col1A1 at 6 months post-surgery (b), and significant up-regulation of MMP-3 expression (d) in the injured discs, compared with the control group or the PLGA implantation group (*P < 0.01, vs. control group; # P < 0.01, vs. PLGA implantation group)
