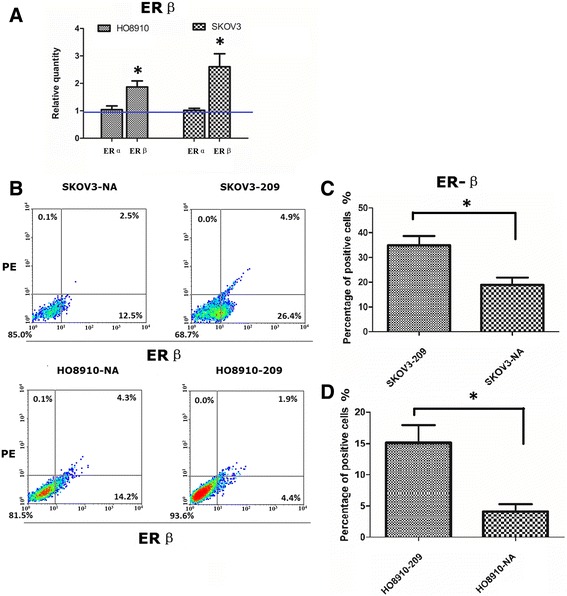
Fig. 4.

Knockdown of WFDC2 increases expression of ERß in HO8910 and SK-OV-3 cells. a Normalized ERα and ERß RNA levels in WFDC2 knockdown cells and control cells using real-time RT-PCR. The relative quantities of ERα and ERß were determined using densitometry and normalized with GAPDH. *P < 0.05 versus the control. b Flow cytometric graphs for ERß expression in WFDC2 knockdown cells and control cells. c Quantification of the percentages of ERß-positive cells in WFDC2 knockdown cells and control cells. *P < 0.05 versus the control
