Fig. 1.

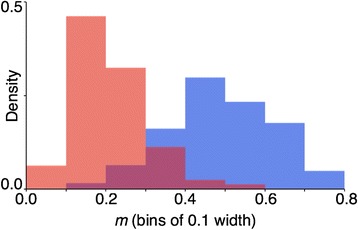
Frequency histograms of the mean value of m under random (blue) and m-trait (red) mating (purple represents areas of overlap) for the 500 generation cases. See Table 1 for more details

Frequency histograms of the mean value of m under random (blue) and m-trait (red) mating (purple represents areas of overlap) for the 500 generation cases. See Table 1 for more details