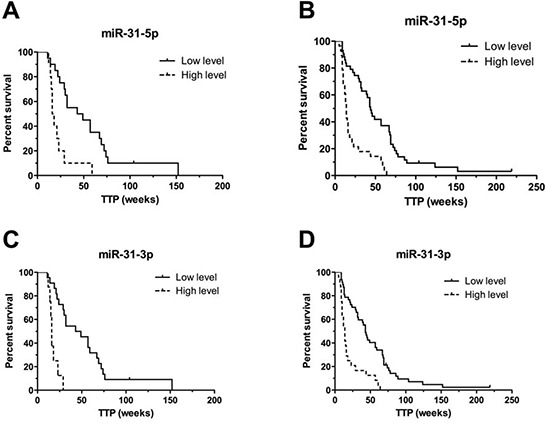
Figure 2. Kaplan-Meier survival curves of patients treated with cetuximab estimating TTP in weeks according to miR-31-5p and miR-31-3p expression profiles (P < 0.001).

Patients with high expression level of relevant miRNA are illustrated by dashed line. A, C. performed on validation set 1 (N = 28), B, D. performed on complete set of cetuximab samples from exploratory and validation set 1 (N = 69).
