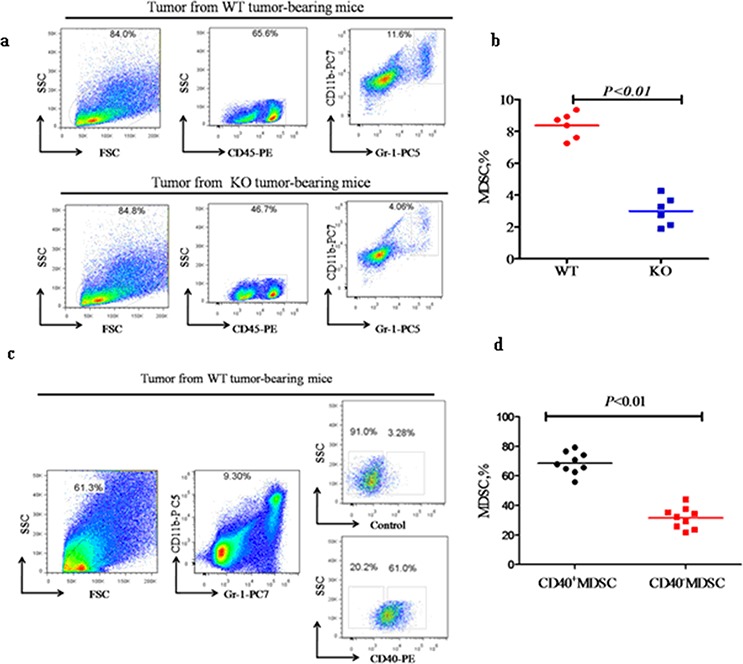
Figure 6. CD40 expression is associated with increased MDSC recruitment to tumor tissues.

Flow cytometry analysis of the percentage of CD11b+Gr-1+ MDSC (MDSC%) within tumor tissues from WT (n = 6) or KO (n = 6) mice a and b., and the CD40+ versus CD40−MDSC subsets within WT tumor tissues (c and d. n = 9). a) Representative flow cytometry images demonstrating the gating strategy and a higher MDSC% in tumor tissues from WT mice when compared with KO mice. b) Quantification of the MDSC% determined in a. c) Representative flow cytometry images demonstrating the gating strategy and a significantly higher percentage of CD40+ than CD40− MDSC in WT tumor tissue. d) Quantification of the flow cytometry data shown in c.
