
Figure 3. Gene expression profiling of U937 cells upon treatment with shikonin and its derivatives.
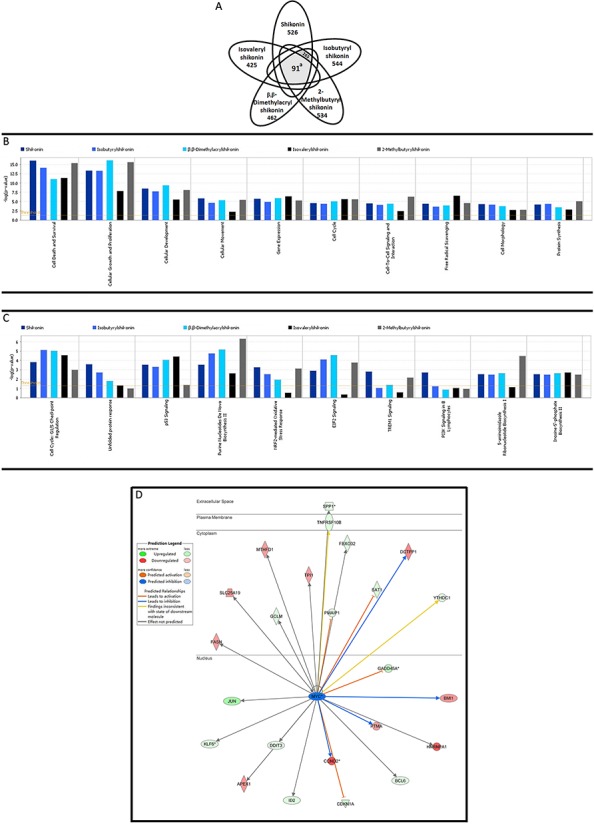
A. Venn diagrams: Numbers of genes deregulated after 24 h. Only molecules with fold changes ≥ ± 1.65 are presented in the diagram. a, p < 0.0001, indicating the probability of 91 genes occurred by chance, calculated using Monte Carlo simulation method by R language. B and C. Pathway analyses: Top cellular functions and canonical pathways affected by shikonin and its derivatives examined by mRNA microarray hybridization. P-values were calculated using right-tailed Fisher's exact test. D. Deregulated genes under the influence of MYC as common upstream regulator inhibited by shikonin and its derivatives.