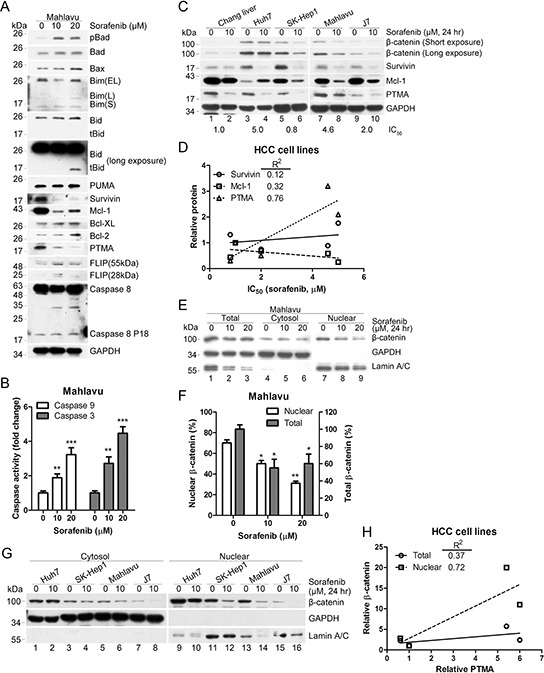
Figure 1. Sorafenib inhibits β-catenin levels and induces mitochondrial apoptotic pathways.

A. PTMA and other antiapoptotic proteins are down-regulated by sorafenib. PTMA, Mcl-1 and survivin protein levels were severely reduced in HCC Mahlavu cells exposed to sorafenib. B. Activation of caspase-9 and caspase-3 in sorafenib-treated Mahlavu cells. The cells were treated with sorafenib at the indicated concentrations for 24 hrs and caspase activities in cell lysates were measured using a colorimetric assay. C. Co-inhibition of β-catenin and PTMA by sorafenib in HCC cells. Cell lines indicated on top were treated or not with 10 μM sorafenib for 24 hrs and processed for immuno-blotting. IC50 values (the concentration of sorafenib that inhibits 50% of cell growth) for each cell line are indicated below the panels. D. Relative PTMA level correlated with the IC50 values of HCC cell lines. Correlation between survivin/Mcl-1 and IC50 values is also shown. Correlation index, R2 = 0.76, for PTMA was greater than for the two other proteins. E. Reduction of nuclear β-catenin by sorafenib. Mahlavu cells were treated with the indicated concentration of sorafenib for 24 hrs and cell extracts were prepared. F. Statistical plot of experiments shown in (E) (G) Reduction of nuclear β-catenin by sorafenib in HCC cell lines. H. Relative nuclear β-catenin level correlated with relative PTMA level. Plot of experiments shown in (C and G). Results of three experiments are expressed as mean ± SD. *P < 0.05, **P < 0.01, ***P < 0.001. Fifty μg of proteins from each sample were processed for immuno-blotting.
