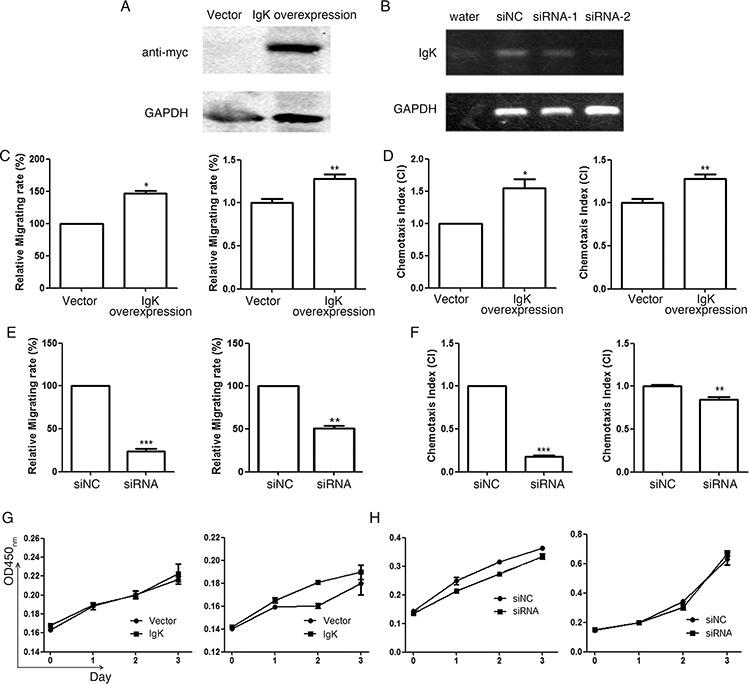
Figure 5. The effect of IGK expression on AML cell migration, chemotaxis and proliferation.

A. Western blot analysis with anti-myc antibody showed IGKV1-5*03/IGKJ3*01 (with myc tag) overexpression after transfecting the expression plasmid into HL-60 cell line. B. RT-PCR analysis showed that siRNA-2 had a much higher efficiency to inhibit IGK expression than siRNA-1. siRNA-2 was therefore used in the following knockdown experiments. Water and siNC were used as negative controls. C. The relative migrating rate of HL-60 (left) and NB4 (right) with IGK overexpression, using empty vector as the control. D. The chemotaxis index (CI) of HL-60 (induced by fMLP, left) and NB4 (induced by CXCL12, right) with IGK overexpression, using empty vector as the control. E. The relative migrating rate of HL-60 (left) and NB4 (right) with IGK knockdown by siRNA-2, using siNC as the control. F. The chemotaxis index (CI) of HL-60 (induced by fMLP, left) and NB4 (induced by CXCL12, right) with IGK knockdown using siRNA-2, using siNC as the control. G. The proliferation curves of HL-60 (left) and NB4 (right) with IGK overexpression, using empty vector as the control, assessed by CCK-8 assay. H. The proliferation curves of HL-60 (left) and NB4 (right) with IGK knockdown, using siNC as the control, assessed by CCK-8 assay.
