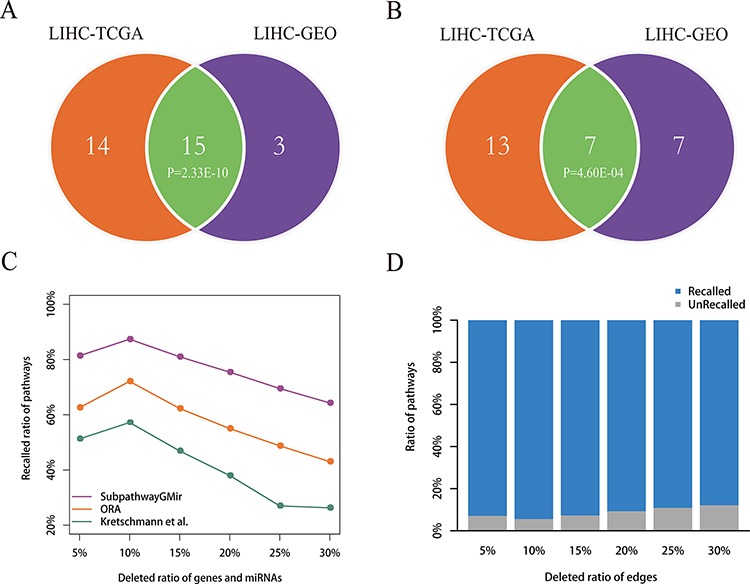
Figure 5. Reproducibility and robustness analyses.

A–B. Reproducibility analysis. Venn diagram A depicts all significant pathways identified by Subpathway-GMir in LIHC data sets 1 and 2. Venn diagram B depicts the significant pathways identified by Subpathway-GMir but not by both ORA or the Kretschmann et al. method in LIHC data sets 1 and 2. C–D. Robustness analysis. Figure C shows the mean ratio of recalled pathways using Subpathway-GMir, ORA and the Kretschmann et al. method after randomly deleting N% of genes and miRNAs from the corresponding profiles, where N = 5, 10, …, 30. Figure D shows the mean ratio of recalled pathways using Subpathway-GMir after randomly deleting N% of the edges in each RMPG, where N = 5, 10, …, 30.
