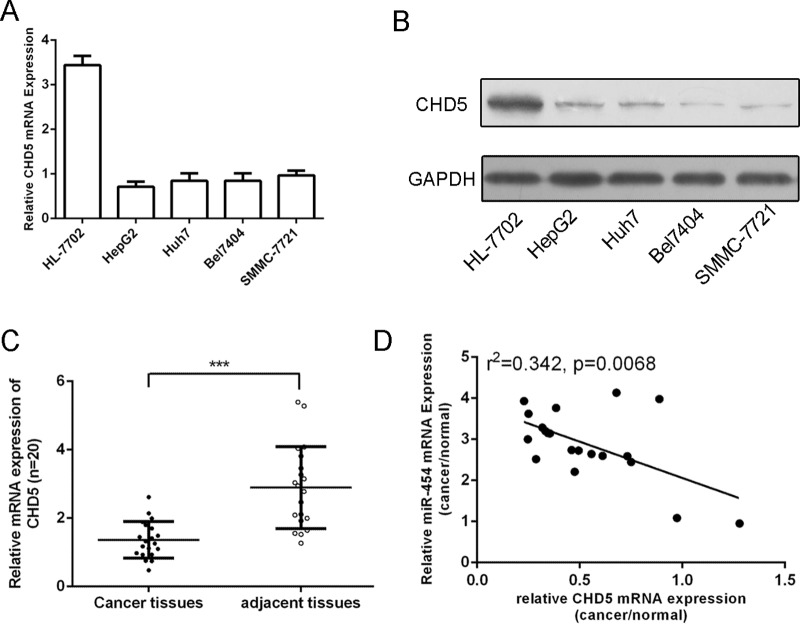
Figure 7. CHD5 was downregulated in HCC tissue and cell lines and was inversely expressed with miR-454.
A. Expression levels of CHD5 in four cell lines (MHCC-97H, QGY-7703, SMMC7721 and HepG2) and one normal liver cell (HL-7702 cells) were detected using qRT-PCR analysis. B. The protein expression levels of CHD5 in four cell lines (MHCC-97H, QGY-7703, SMMC7721 and HepG2) and one normal liver cell (HL-7702 cells) were detected using western blot. C. The expression of CHD5 in HCC tissues was significant lower than in adjacent tissues. D. Comparison of miR-454 levels and levels corresponding to CHD5 in HCC exhibited significantly inverse correlation between CHD5 and miR-454 (r2 = 0.342, P = 0.0068). ***p < 0.001.

