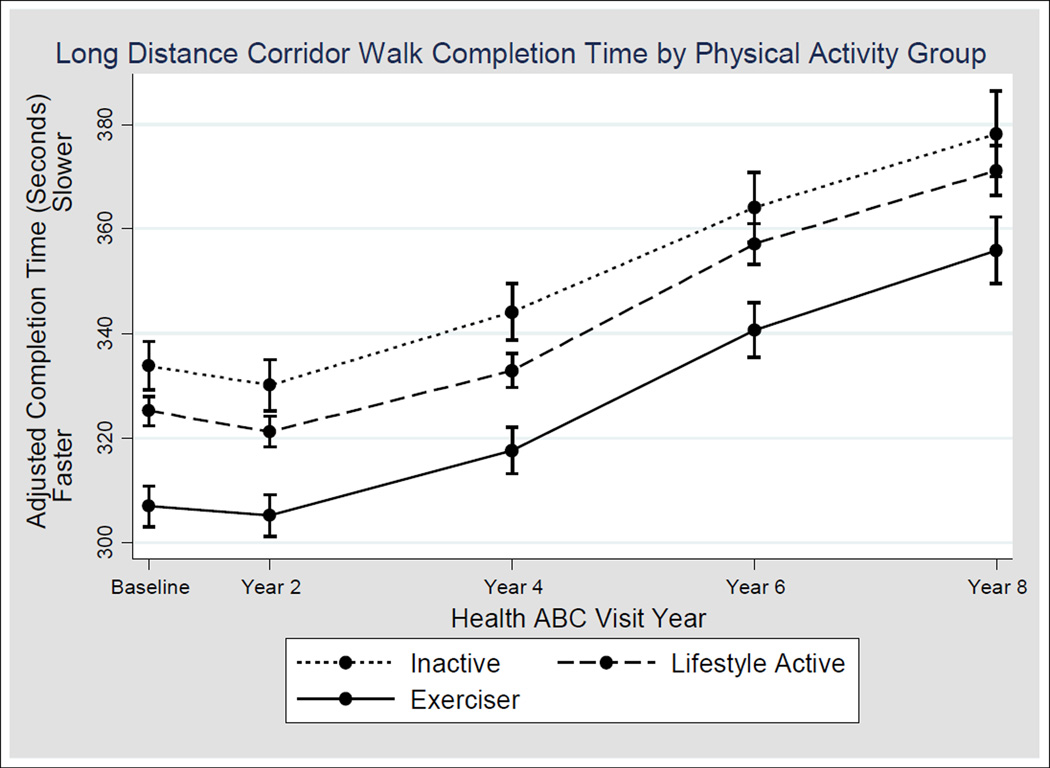
Figure 2.
Change in Long Distance Corridor Walk (LDCW) Completion Time by Physical Activity Group. The figure represents the longitudinal completion times (mean and 95% confidence interval) based upon final model (adjusted for age, sex, body mass index, Short Physical Performance Battery (SPPB) score, poor health at baseline, reporting pain while walking, reporting that walking ¼ mile is easy, SPPB score and associated interactions with time as well as main effects for race and indicating that walking ¼ mile is easy) for the 1948 participants who had a baseline LDCW completion time and at least one other completion time observation. The number of participants with a completion time at each visit is as follows: Baseline visit: n=1948 (n=377 inactive, n=1024 lifestyle active, n=547 exercisers), Year 2: n=1635 (n=304 inactive, n=806 lifestyle active, n=471 exercisers), Year 4: n=1419 (n=267 inactive, n=732 lifestyle active, n=420 exercisers), Year 6: n=1201 (n=197 inactive, n=636 lifestyle active, n=368 exercisers), Year 8: n=924 (n=157 inactive, n=477 lifestyle active, n=290 exercisers).

