Fig 1.

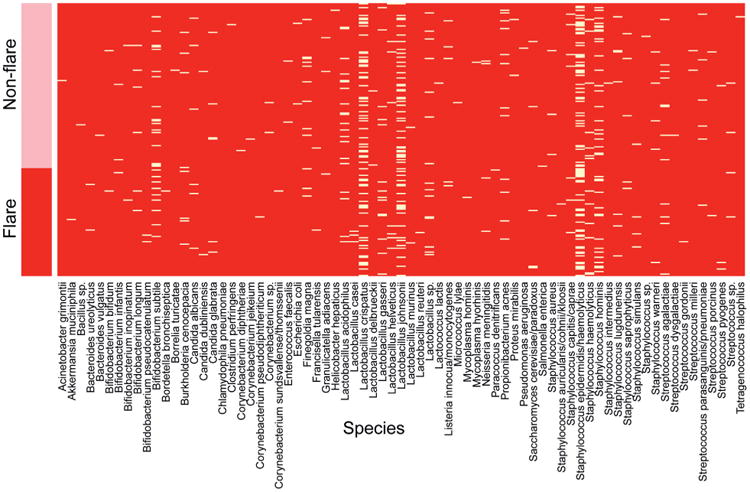
Presence of species by flare status, VB2. Pink bar denotes nonflare group participants and red bar denotes flare group participants. White lines in heat map indicate presence of species listed alphabetically along bottom of heat map.

Presence of species by flare status, VB2. Pink bar denotes nonflare group participants and red bar denotes flare group participants. White lines in heat map indicate presence of species listed alphabetically along bottom of heat map.