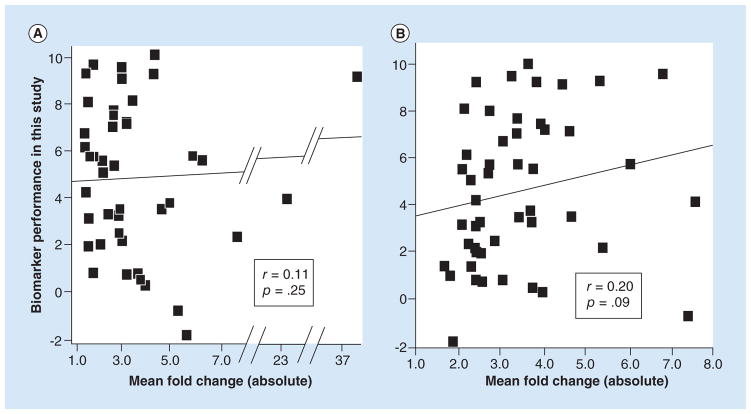
Figure 3. Scatter plots showing that fold change in supporting studies did not predict the performance of biomarker candidates.
The performance values (y-axis) were derived by rescaling the differential expression p-values reported in Tables 1 and 2 and using negative values for two of the miRNAs because their expression in tumor versus normal was opposite from the direction expected (see statistics methods). The line is the best fit line from the Pearson correlation analysis, r’s are the correlation coefficients and the p’s are the significance values of the correlations (1-tailed). (A) Correlation with the biomarker candidates ranked by Guan et al. [2] using the mean fold-change values reported by Guan et al. [2]. n = 43 miRNA biomarker candidates. One biomarker candidate with an expected fold change of 171.6 was excluded as an outlier. If this marker were included, the correlation coefficient would be slightly negative: −0.06 (p = 0.72, two-tailed). (B) Correlation with the biomarker candidates ranked by Guan et al. [2] using the mean fold-change values that we calculated using the supporting studies in Vosa et al. [3]. n = 48 miRNA biomarker candidates.

