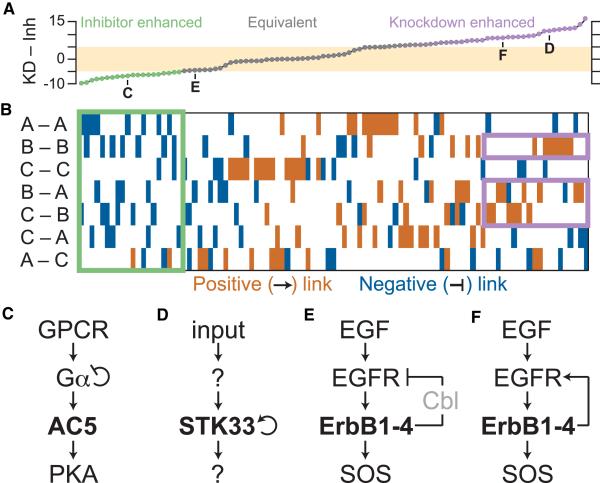
Figure 4. Network Motifs Give Rise to Knockdown/Inhibitor Discrepancies in Three-Tiered Enzyme Cascades.
(A) Exhaustive reconfiguration of a three-tiered Michaelian cascade (Figures 1C and 1D) with all combinations of one to two regulatory edges (Figure S3A). The integrated differences between KD and inhibition (Inh) were calculated across the full range of perturbation as in Figures 1E and 1F. Networks were considered approximately equivalent when the magnitude of KD – Inh discrepancy was less than five (tan). Bold letters refer to the network motifs in Figures 4C–4F.
(B) Color map illustrating the network topologies giving rise to the knockdown/inhibitor discrepancies in (A). Activating edges between enzymes are indicated in brown, and inhibitory edges are indicated in blue. Motifs for enhanced inhibitor and knockdown potency are shown in green and purple, respectively.
(C) G protein-coupled receptor (GPCR) signaling from Gα to AC5 to protein kinase A (PKA).
(D) Autoactivation of STK33 within an unknown enzymatic cascade.
(E and F) EGF signaling from EGFR to ErbB family receptors to SOS, including (E) negative feedback from Cbl or (F) positive feedback from transphosphorylation.
See also Figure S3, Table S2, and Data S1.

