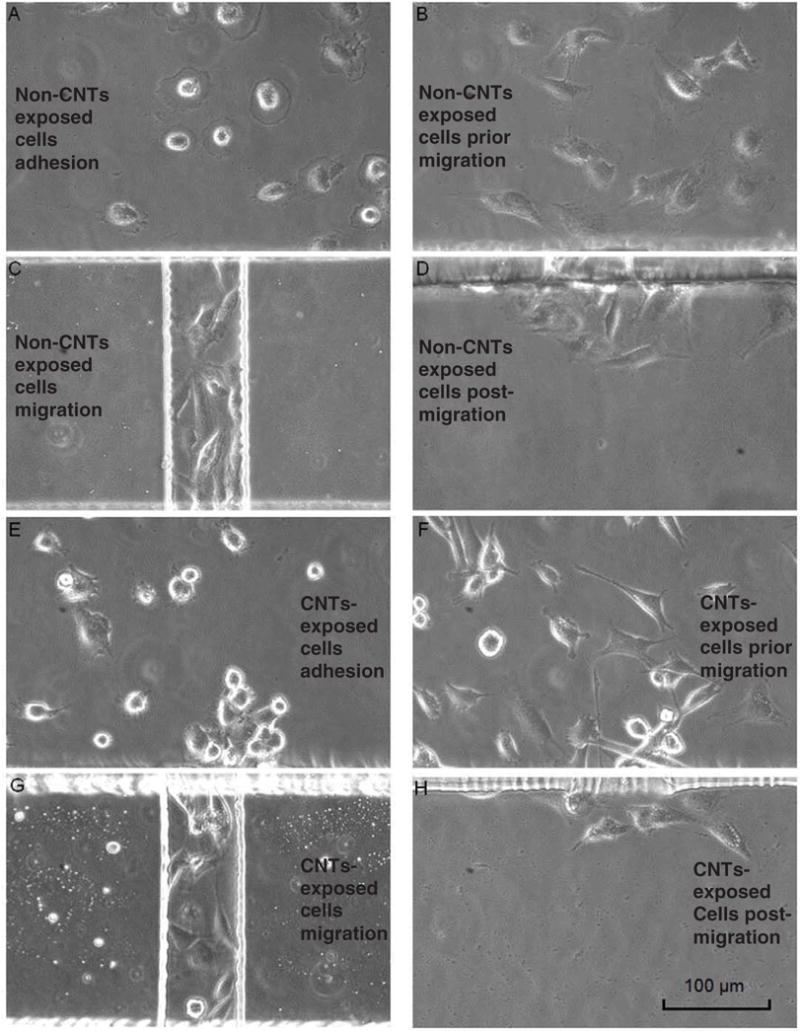
Figure 3.

Cell morphologies shown at their adhesion, prior to migration, during migration and post migration, respectively. (A)–(D) show the morphology of non-SWCNT-exposed cells; (E)–(H) show the morphology of SWCNT-treated cells. Most of the cells were flattened after adhesion, and then gradually changed to spindle shapes prior to their migration. (A) Non-SWCNT exposed cells’ morphology after the initial adhesion; (B) prior to their migration (~6 h after adhesion); (C) during their migration; (D) after their migration. (E) SWCNT-exposed cells’ morphology after initial adhesion; (F) prior to their migration; (G) during their migration; (H) after their migration. Scale bar is 100 μm.
