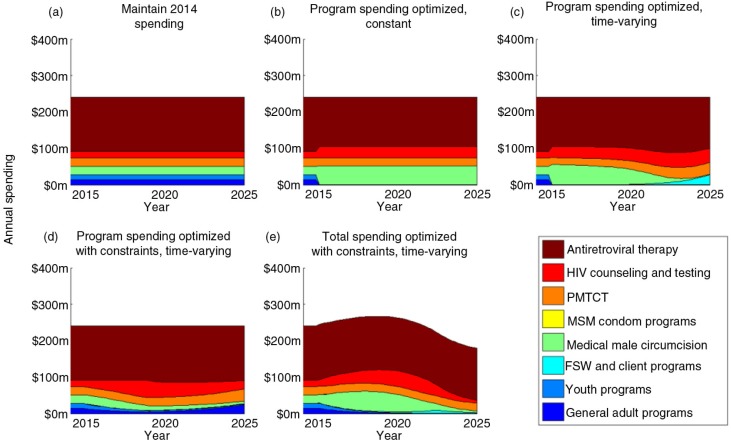
Figure 1.
Direct programme spending in Zambia between 2014 and 2025 under different scenarios. The 2014 spending allocation is considered as baseline for the purpose of our scenario comparisons. The plots show optimal redistribution of funds between 2015 and 2025 using (a) no optimization (i.e. maintaining 2014 spending); (b) optimized programme spending that is constant over time; (c) time-varying optimization of programme allocations, with no constraints; (d) time-varying optimization of programme allocations, considering implementation constraints (scale-up/down of programmes capped at 30% per year), and ethical constraints (where ART and PMTCT cannot decrease past 2014 levels); and (e) time-varying optimization of total 2015 to 2025 spending and programme allocations, also considering the same constraints.

