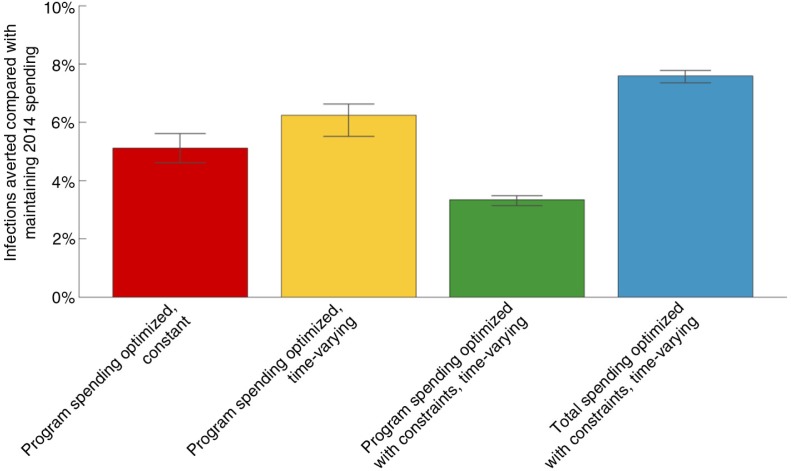
Figure 2.
The percentage of infections averted between 2015 and 2025 for each of the scenarios shown in Figure 1 compared with a baseline of maintaining 2014 spending. The uncertainty bars were determined by repeating the optimization process 40 times using an ensemble of 40 projections within the uncertainty bounds of the model calibration with an ensemble of 40 cost-outcome curves within their respective uncertainty bounds (see the Supplementary file for figures illustrating the uncertainty in model calibration and the cost-outcome curves).

