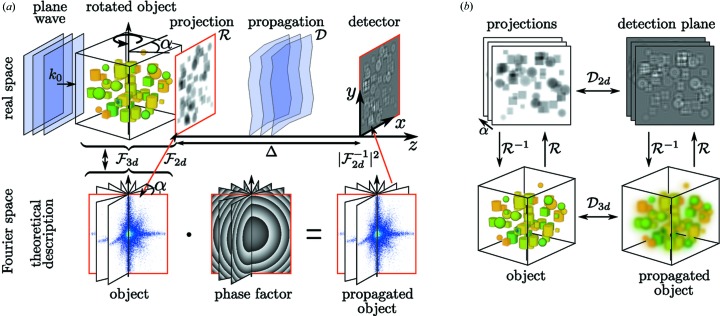
Figure 1.
(a) Schematic of holographic phase contrast imaging. A plane wave illuminates the object, leading to an exit wave in the xy plane as given by the projected optical indices, followed by free space propagation resulting in holographic phase contrast formation as recorded in the detection plane at distance Δ. The projection  and propagation
  process can be described theoretically in Fourier space by multiplying the central slices of the object’s Fourier transform with a radially symmetric phase factor. (b) For weakly interacting objects, the projection operation
  and the propagation operation
  can be permuted, allowing for the propagation of the three-dimensional index of refraction.

