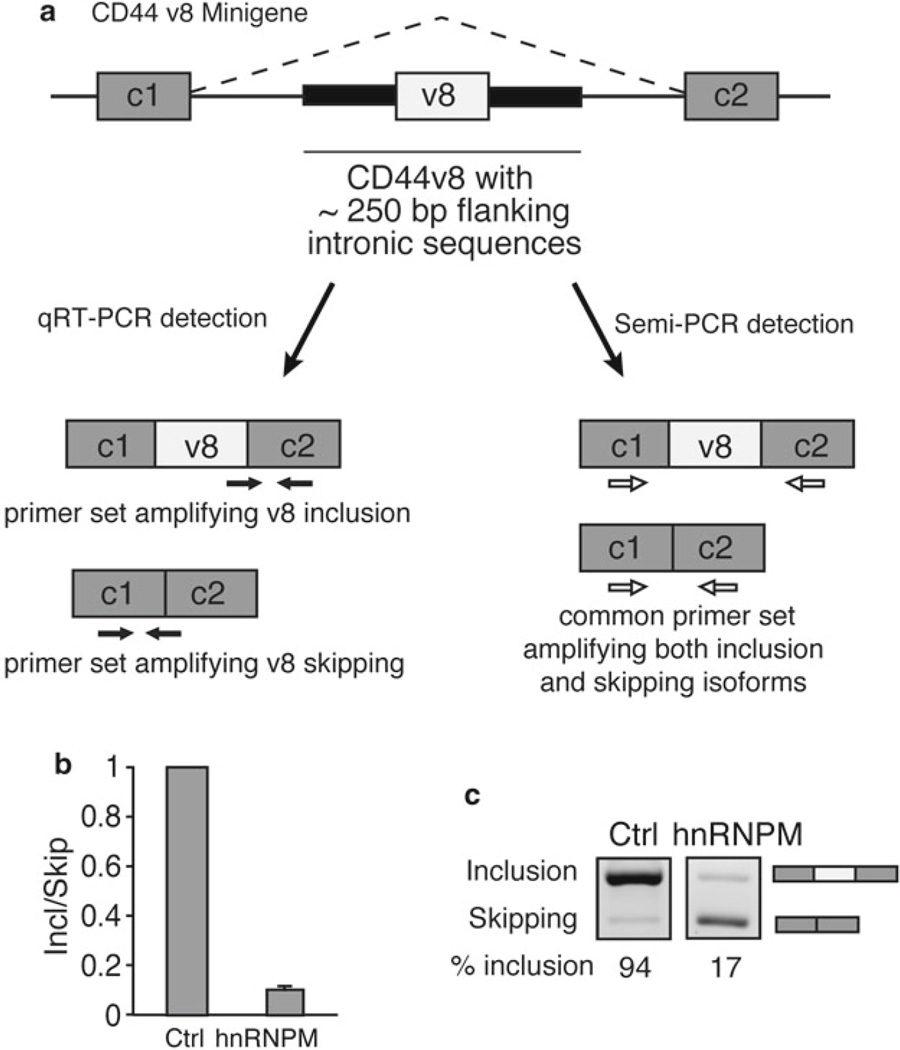
Fig. 3.
A splicing minigene assay for characterization of exon skipping. (a) A schematic of the CD44 v8 minigene is shown. The CD44 v8 variable exon flanked by approximately 250 bp of upstream and downstream intronic sequence is cloned between constitutive exons c1 and c2. Exons are shown as boxes and introns as lines. Primer sets in black are used for qRT-PCR reactions. The primer set in white is designed for semi-quantitative methods. (b) qRT-PCR data after co-transfection of 100 ng CD44 v8 minigene with 400 ng of splicing factor hnRNPM using v8 inclusion and skipping primers in Table 2. A relative Inclusion/Skipping ratio (Incl/Skip) is plotted indicating that the Incl/Skip ratio decreases when hnRNPM is transfected. (c) Semi-quantitative PCR image showing decreased percent inclusion (% inclusion) after transfection with 400 ng hnRNPM using semiquantitative v8 primers in Table 2. Both images were from the same gel with uniform exposure time. % inclusion was calculated using densitometric image analysis software to divide the pixel intensity of the inclusion band by the combined pixel intensity of both inclusion and exclusion bands. Figure 3b and c was modified from Fig. 4 in our previous publication [8] under Creative Commons License CC-BY-NC 4.0

