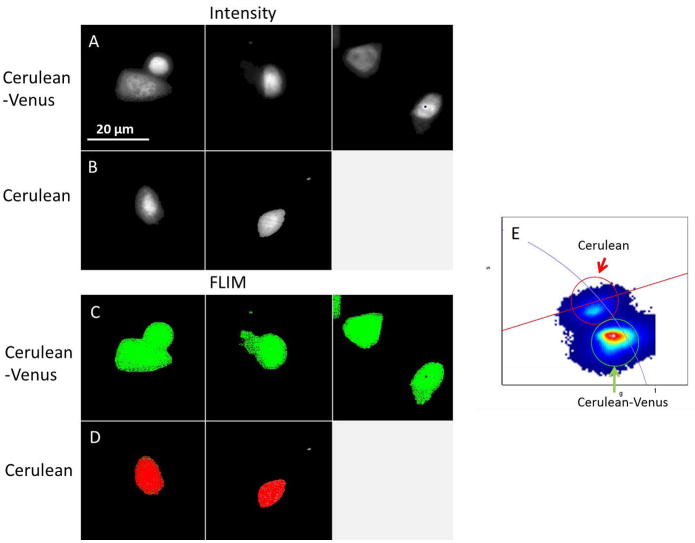
Figure 5.
FLIM-FRET measurement: cells transfected with Cerulean (donor only) and cells transfected the Cerulean-Venus construct (FRET pair). A) Three different images of cells transfected with the Cerulean-Venus construct. B) Cells transfected with the Cerulean donor only. C) Selection of the phasors that correspond to the shorter lifetime of the FRET construct at donor fluorescence. D) Selection of the phasors corresponding to the donor only cells. E) The phasor plot of the 5 images (3 of FRET pair and 2 of donor only) shows a lifetime difference of donor fluorescence due to the FRET effect.

