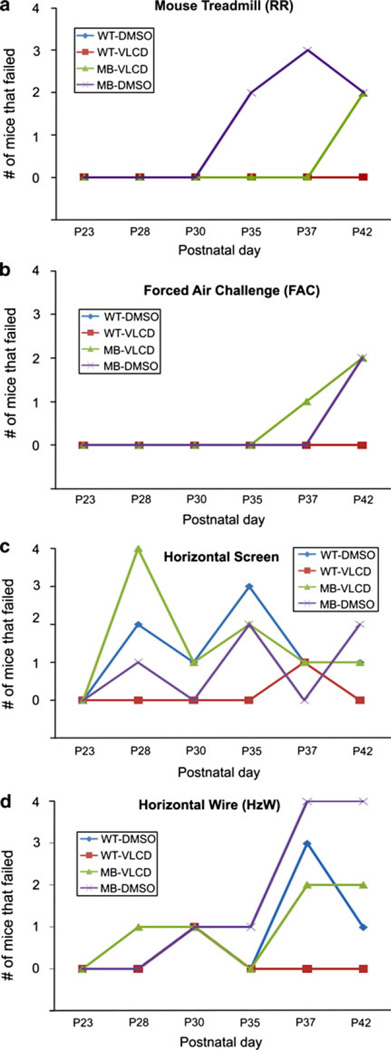
Fig. 2.
Experimental test results. a Rotarod results, graph shows number of mice in each group that failed the mouse rotarod test per day. MB-DMSO had more failing on days 35 and 37 but had the same number of MB-VLCD mice failing on day 37. A Fishers Exact test was used to identify any significant differences between numbers of failing mice per group. b Forced Air Challenge Results, graph shows number of mice in each group that failed the forced air challenge per day; MB-VLCD had more failing on day 37 but not on day 42. A Fishers Exact test was used to identify any significant differences between numbers of failing mice per group. c Horizontal screen Results, graph shows number of mice in each group that failed the forced air challenge per day. On P28, all groups except WT-VLCD had at least 1 failing mouse. MB-VLCD had significantly more mice (*P = 0.003) fail than any other group however; the trend was not consistent for subsequent days. For postnatal days 30, 35, 37, and 42 all groups continue to have some failing mice, including the wild type mice, but no group had significantly more failings after P28. A Fishers Exact test was used to identify any significant differences between numbers of failing mice per group. d Horizontal Wire Results. Graph shows number of mice in each group that failed the forced air challenge per day. All groups had failing mice starting on P28. A Fishers Exact test was used to identify any significant differences between numbers of failing mice per group. No group had significantly more failing mice than any other group on any given day

