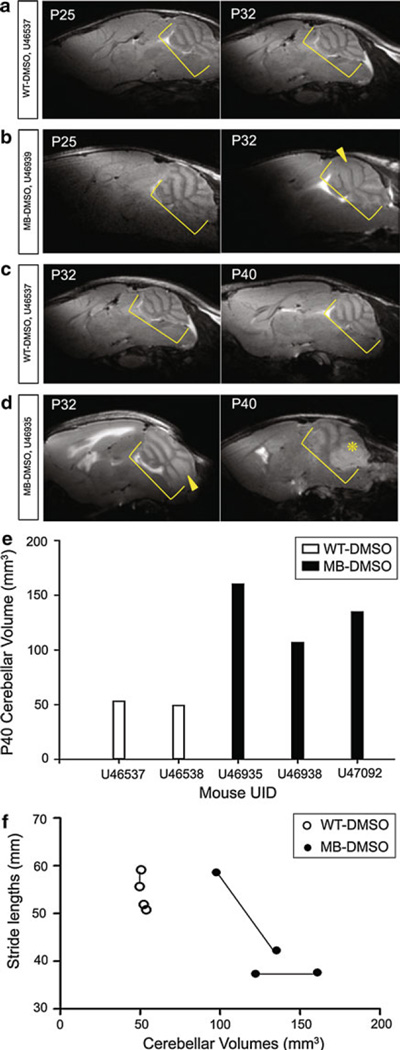
Fig. 4.
Wild type and Medulloblastoma-prone Cerebellum MRI Scans during Progression. Yellow brackets denote cerebellums, with layer thickening (arrowhead) and tumor mass (asterisk). a WT-DMSO (top) P25 (left) and P32 (right) on same mouse, U46537. b MB-DMSO (bottom) P25 (left) and P32 (right) on same mouse, U46539. c WT-DMSO (top) P32 (left) and P40 (right) on same mouse, U46937. d MB-DMSO (bottom) P32 (left) and P40 (right) on same mouse, U46935. e WT-DMSO and MB-DMSO cerebellar volumes calculated from MRI scans on P40. f Correlation curve between cerebellar volumes and stride lengths of MB mice (n = 2) and WT mice (n = 2). Each set of 2 connected points indicates one mouse from P32 to P40. Curve is only suggestive due to small sample number

