
Figure 4c:
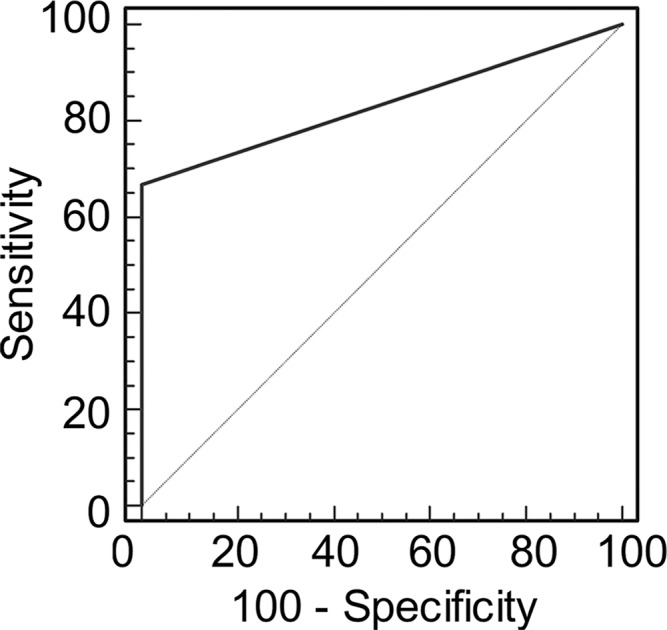
Graphs show receiver operating characteristic curve analysis of diagnostic performance of (a) conventional MR imaging, (b) conventional MR imaging combined with DWI, and (c) conventional MR imaging combined with DWI and DCE MR imaging for reader 2. Note again the progressive increase in area under the curve (0.506 in a, 0.704 in b, 0.833 in c).