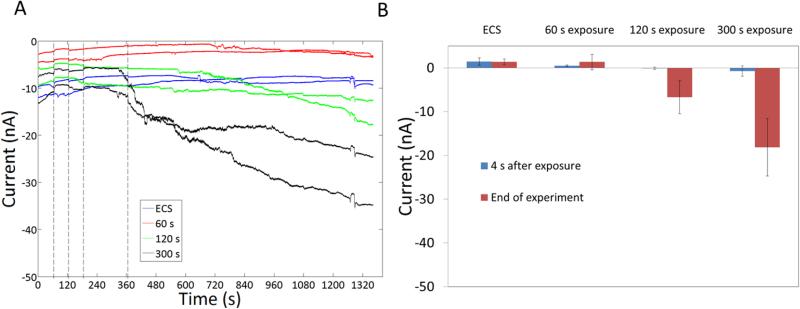
Figure 10.
Exposure of HEK 293 A cells to L-PEI for 300 s causes increased membrane permeability that is then not reversible for over 900 s. A) Representative current traces. The first dotted line at 65 s indicates the release of L-PEI at 65 s. Subsequent dotted lines indicate 60 s, 120 s and 300s from release of L-PEI respectively when L-PEI exposure was stopped and cells were exposed to ECS alone. B) The difference between currents at 65 s and at different time points.

