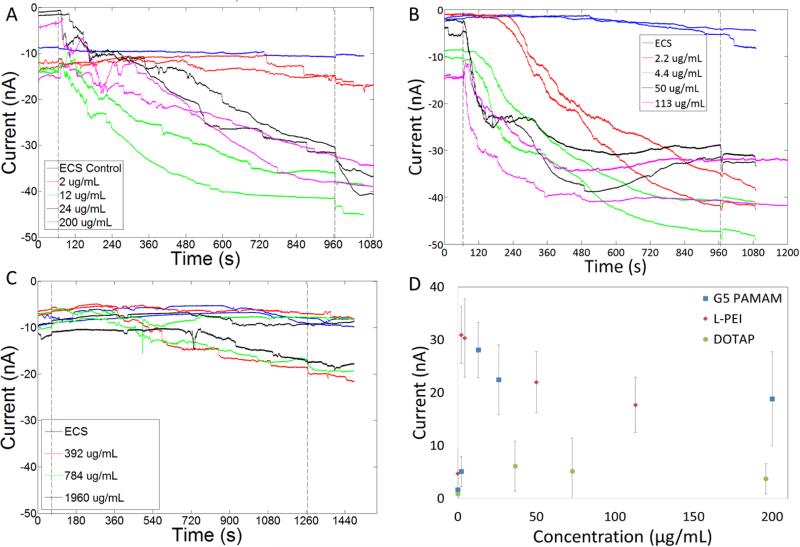
Figure 2.
Membrane currents of cells exposed to G5-PAMAM (A), L-PEI (B) and DOTAP (C). As the concentration of cationic polymers increased the current induced did not change. Some cells exposed to DOTAP showed a small increase in current. Average increase in current induced by the different vectors are shown in D. In figures A-C, the first dotted line at 65 s indicates the release of the free cationic vectors resulting in exposure of these compounds to the cells. The second dotted line denotes the end of compound exposure.

