
Fig 3. Total RNA electropherograms and 5S/18S rRNA index in the gonads of megrims.
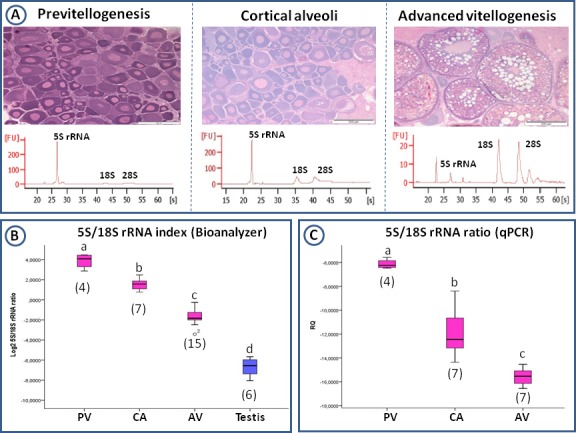
(A) Gonad histology (scale bars = 200 μm) and electropherograms representative of total RNA distribution in megrim ovaries (captured in February, May and November) in different stages of oogenesis (previtellogenesis -PV-, cortical alveoli -CA- and advanced vitellogenesis -AV-). [FU] = Fluorescence, [s] = Time in seconds. The peak at around 20 seconds corresponds with the Agilent marker. 5S rRNA band appears between 25 and 30 seconds, 18S rRNA band around 40 seconds and 28S rRNA in between 45 and 50 seconds. (B) 5S/18S rRNA index in ovaries in different developmental stages and in testis as quantified from electropherograms. (C) 5S and 18S rRNA index as obtained after qPCR analysis of the levels of transcription of both genes in ovaries in different developmental stages. Numbers between parentheses indicate the number individuals analysed per group. Different letters indicate significant differences among pairs of means (one-way ANOVA, p<0,05 in B, Jonckheere-Terpstra, p<0,05 in C).