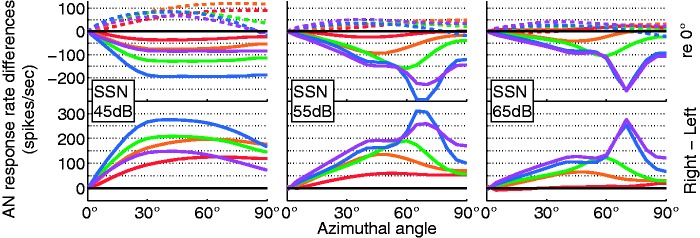
Figure 6.
AN response rate differences for speech-shaped noise at three different levels. (Top) Right (dashed lines) and left AN response rates relative to a 0° reference are plotted as a function of azimuthal angle for the five AN frequency bands. (Bottom) Interaural AN response rate difference as a function of azimuthal angle for the AN frequency bands. The respective color corresponds to the color code as in Figures 3 and 4. The level dependence is due to flooring effects at the contralateral left side (no responses) at 45 dB and strong compression effects especially at the right side at 65 dB.
AN = auditory nerve; SSN = speech-shaped noise.

