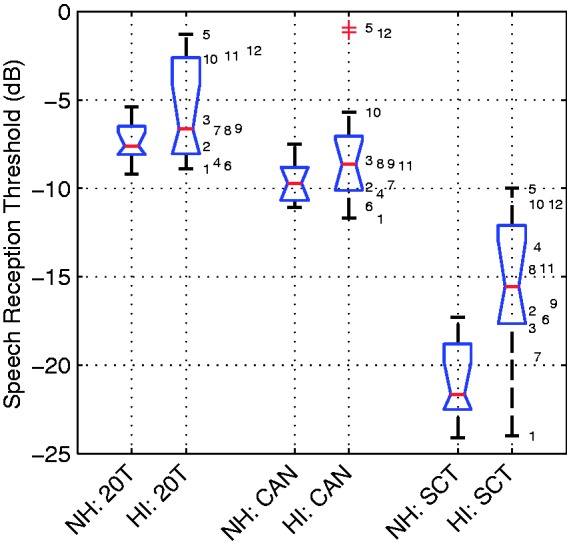
Figure 2.

Distribution of measured speech reception thresholds for the no pre-processing condition, pairwise for both listener groups (left: normal hearing, right: impaired hearing) and separated for noise conditions (from left to right: 20-talker babble [20 T], cafeteria ambient noise [CAN], single competing talker [SCT]). The boxes have lines at the lower quartile, the median value, and the upper quartile. Whiskers extend from each end of the box to the adjacent values in the data. Outliers ( + sign) are data with values beyond the ends of the whiskers. Individual data from the HI listeners are shown by index numbers (cf. Table 1).
NH = normal hearing; HI = hearing-impaired.
