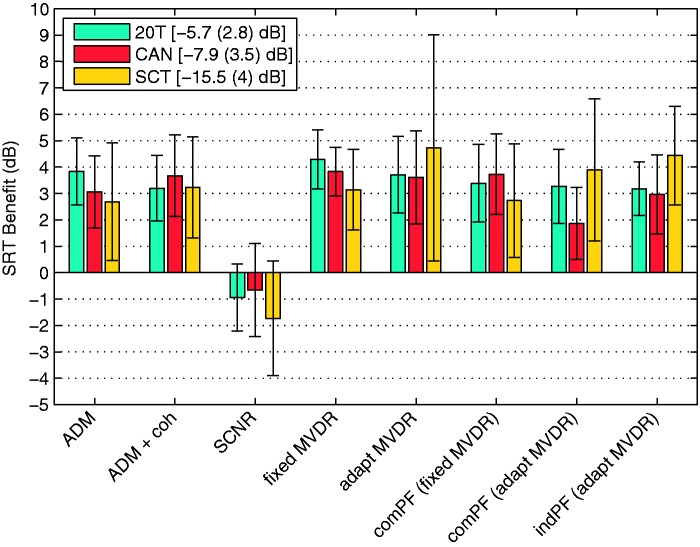
Figure 4.
Averaged individual SRT benefit caused by 8 signal processing schemes for 12 hearing-impaired participants. The error bars denote an interval of ± standard deviation from the mean value. The results are displayed separately for the three noise conditions: 20 T, CAN, and SCT. The legend shows the averaged SRT values measured without pre-processing including standard deviation in each noise condition.
SRT = speech reception threshold; 20 T = 20-talker babble; CAN = cafeteria ambient noise; SCT = single competing talker; ADM = adaptive differential microphone; ADM + coh = adaptive differential microphone in combination with a coherence-based noise reduction; SCNR = single-channel noise reduction; MVDR = minimum variance distortionless response.

