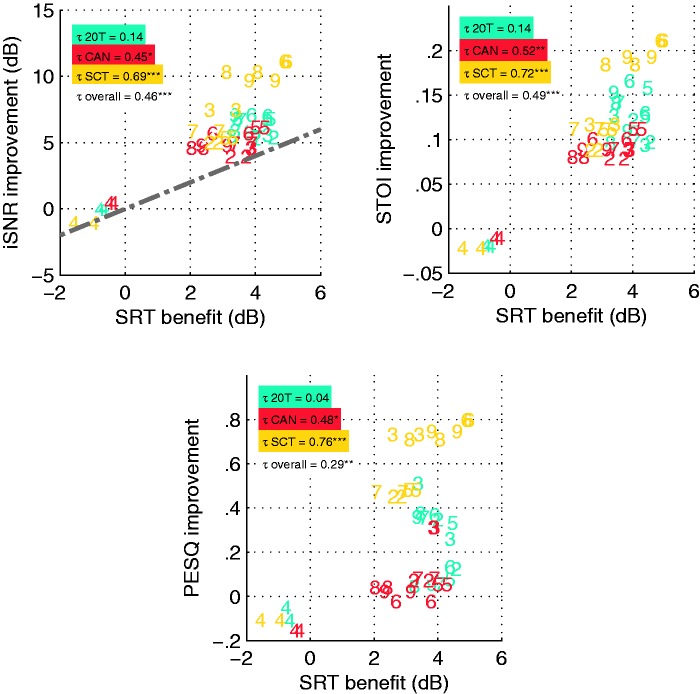
Figure 5.
Correlation between the averaged individual SRT benefits for normal-hearing and hearing-impaired participants and the group-dependent improvements (better channel) calculated within the instrumental evaluation with three different measures (Baumgärtel et al. 2015b). The Kendall rank correlation coefficient data are shown separately for the instrumental measures, iSNR (left panel), STOI (middle panel), and PESQ (right panel). Within each panel, the data are displayed separately for each noise condition; correlation coefficients τ are given in the figure legend. Significant correlation coefficients are marked with *p < .05, **p < .01, and ***p < .001. The dash-dotted line in the left panel (iSNR) represents an idealized linear correlation between the instrumental results and subjective data.
SRT = speech reception threshold; 20 T = 20-talker babble; CAN = cafeteria ambient noise; SCT = single competing talker; iSNR = intelligibility-weighted signal-to-noise ratio; STOI = short-time objective intelligibility; PESQ = perceptual evaluation of speech quality.

