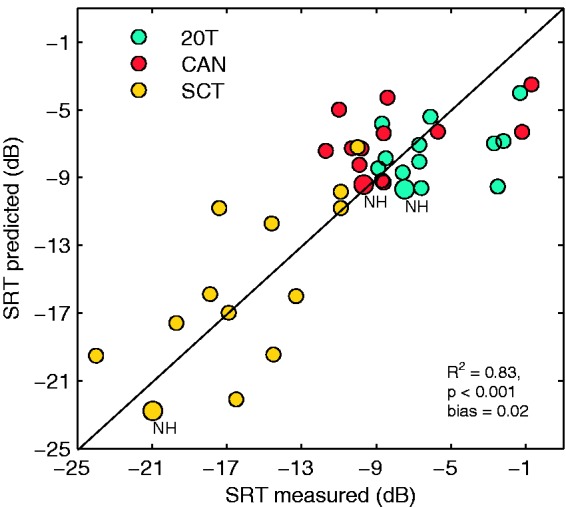
Figure 6.

Scatter plot of predicted SRTs against measured SRTs for normal-hearing and hearing-impaired listeners and three noise conditions (indicated by different colors). Solid line is the bisecting line. The coefficient of determination, R2, was calculated based on individual data of HI listeners and mean data for NH listeners (marked as NH).
SRT = speech reception threshold; 20 T = 20-talker babble; CAN = cafeteria ambient noise; SCT = single competing talker; NH = normal hearing; HI = hearing-impaired.
