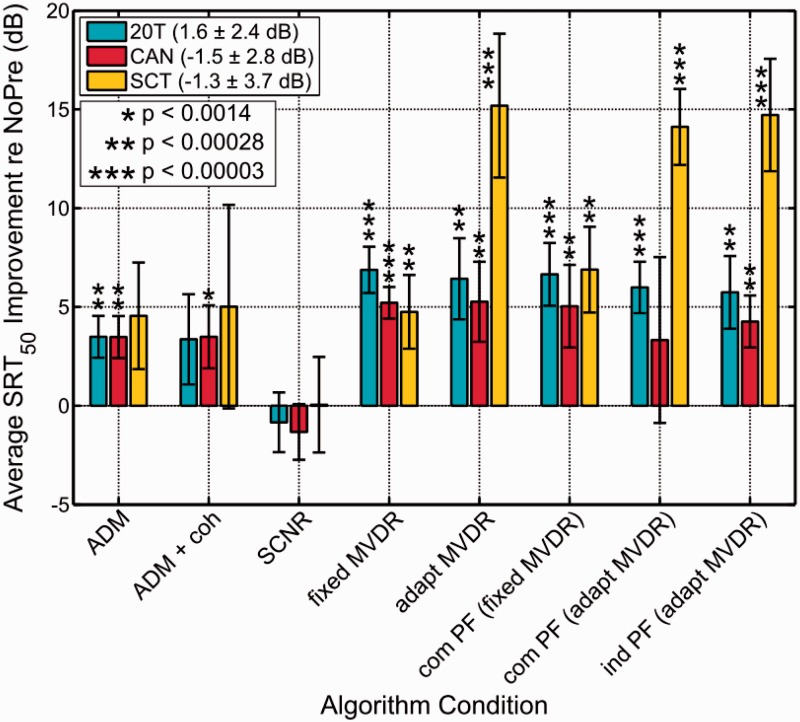
Figure 2.
Average SRT50 improvements compared to unprocessed baseline condition for all signal pre-processing strategies tested. Error bars indicate the standard deviation. Asterisks denote results that are statistically significantly different from SRT50,NoPre (***p < .00003, **p < .00028, *p < .0014) as determined by post hoc pairwise comparisons. All results are averaged across eight subjects. Numbers in the legend represent the average SRT50 in the unprocessed reference condition ± standard deviation.

