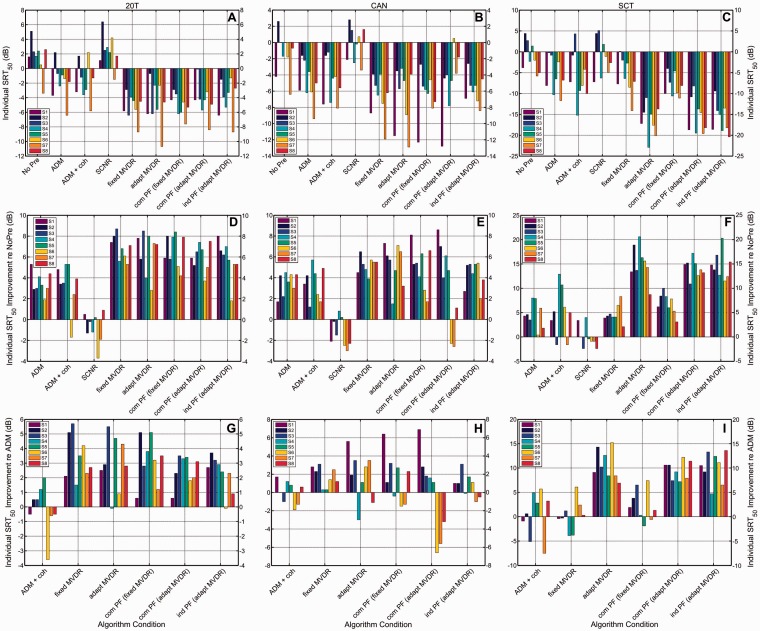
Figure A2.
Individual subject results. Panels A to C show raw SRT50 scores for each subject (S1–S8) for each of the three noise conditions. 20 talker babble in Panel A, cafeteria ambient noise in Panel B, single competing talker noise in Panel C. Panels D to F show SRT50 improvements with respect to the unprocessed signal (NoPre) in each of the three noise scenarios. 20 talker babble in Panel D, cafeteria ambient noise in Panel E, single competing talker noise in Panel F. Panels G to I show SRT50 improvements with respect to the signal processed with adaptive differential microphones (ADM) in each of the three noise scenarios. 20 talker babble in Panel G, cafeteria ambient noise in Panel H, and single competing talker noise in Panel I.

