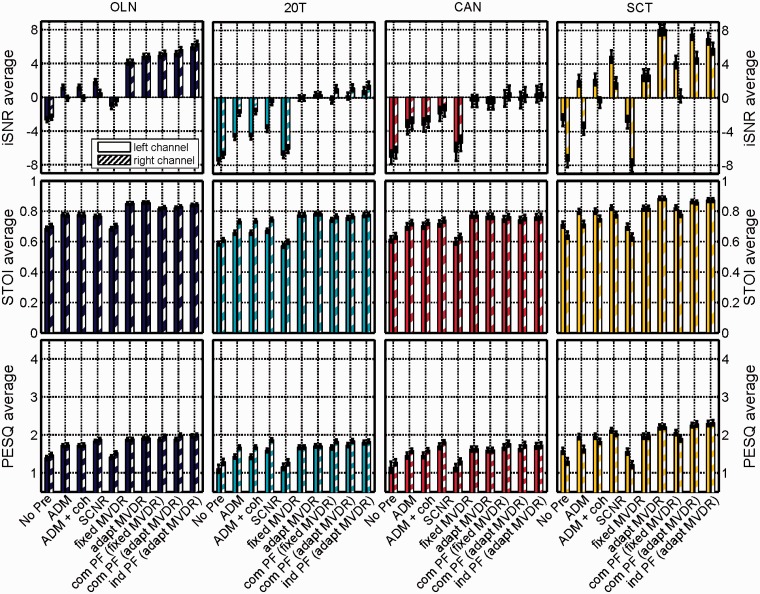
Figure 6.
Instrumental evaluation results at 0 dB input SNR. Top panels show the results for the iSNR measure, middle panels show the results for the STOI measure, and bottom panels show the results for the PESQ measure. Columns from left to right show results for OLN (Navy), 20T (Turquoise), CAN (Red), and SCT (Yellow) noise scenarios. Left channel results are indicated by bar graphs with solid filling, and right channel results by bar graphs with hashed filling. Error bars denote the standard deviation.

