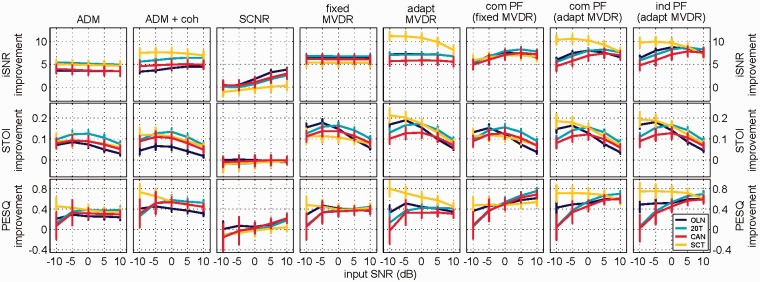
Figure 8.
Better-channel-improvements for all tested algorithms are plotted at varying input SNRs between −10 dB and +10 dB. Top panels show results for iSNR, middle panels STOI, and bottom panels PESQ results. Error bars denote the standard deviation. Color codes are used for the different test scenarios.

