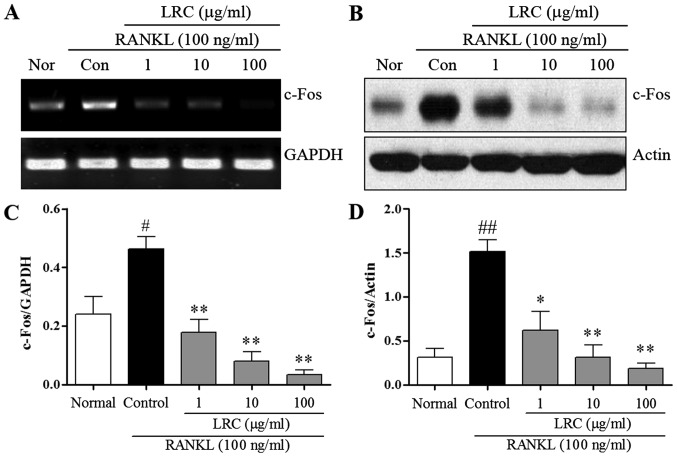
Figure 5.
The effect of LRC on mRNA and protein expression of c-Fos in RANKL-stimulated RAW 264.7 cells. (A) mRNA expression was detected using RT-qPCR. (B) Protein levels were determined by western blot analysis. (C and D) mRNA and protein expression of c-Fos was normalized to GAPDH and actin. Data are represented as the means ± SEM of three independent experiments ##p<0.01 and #p<0.05 compared with normal; **p<0.01 and *p<0.05 compared with control. Nor (normal), untreated cells.

