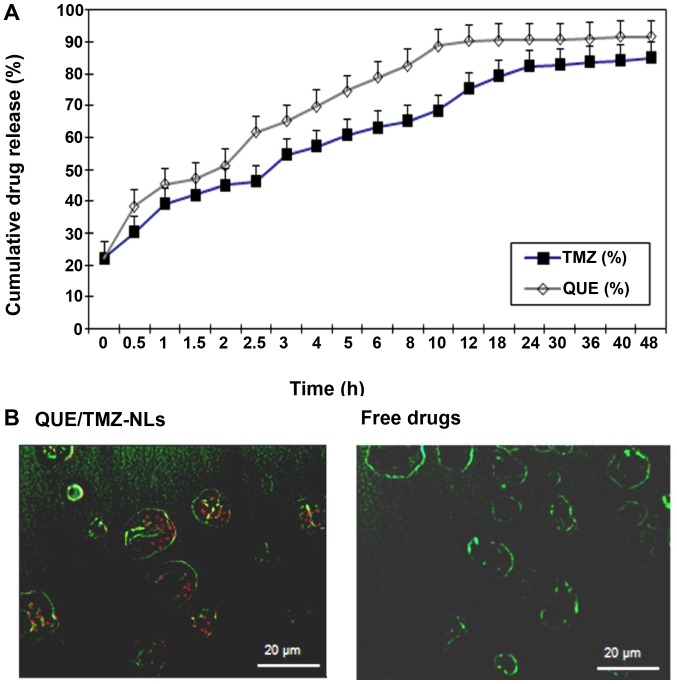
Figure 3.
In vitro drug release profile and cellular uptake of the quercetin and temozolomide-loaded nanoliposomes (QUE/TMZ-NLs). (A) The release of TMZ and QUE from the QUE/TMZ-NLs were monitored within a time frame of 48 h. Data are shown as the means ± SD (n=3). (B) Comparison of the uptake of the QUE/TMZ-FITC-NLs and free drugs by U87 human glioma cells was determined. Representative images taken by confocal microscopy are shown. Red, QUE or TMZ; green, cell nuclei. Scale bar, 20 µm. QUE, quercetin; TMZ, temozolomide; NLs, nanoliposomes.

