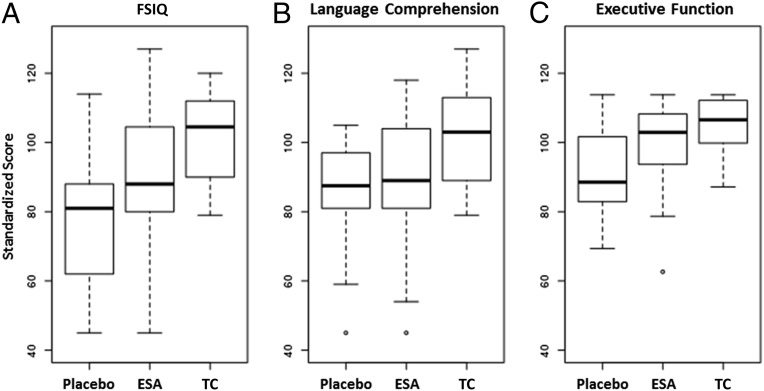
FIGURE 2.
Comparison of FSIQ (A), language comprehension (B), and executive function (C) in placebo, ESA-treated, and TC children. Data shown are box and whisker plots of medians (first and third quartiles). ESA-treated children scored significantly higher in FSIQ (P = .036) and executive function (P = .031).

