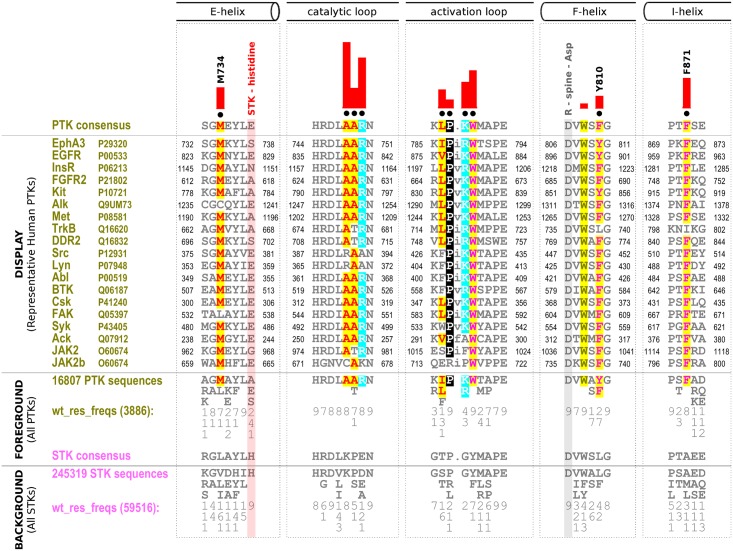
Fig 1. Contrast hierarchical alignment showing key evolutionary sequence constraints imposed on tyrosine kinases.
An alignment of representative human PTKs from diverse PTK sub-families is shown as a display alignment. The foreground set of PTK sequences (16,807 sequences) and the background set of STK sequences (245,319 sequences) are condensed and shown indirectly via consensus patterns and by column-wise amino acid frequencies (indicated by integer tenths) observed in the entire foreground versus background alignments. For example, a ‘5’ indicates that the corresponding amino acid occurs in 50–60% of the given (weighted) sequence set. Amino acid frequencies (denoted wt_res_freq) were determined from weighted sequences to account for overrepresented kinase families and evolutionary clades in the sequence data sets, and the number in parentheses indicates the number of sequences after down-weighting for redundancy. Only divergent substrate-binding regions and key divergent positions that were further examined in this study are shown. The alignment columns that were used to partition the foreground from the background sequences by the mcBPPS procedure are marked with black dots above the display alignment, and the degree to which the foreground amino acid distribution diverges from the background amino acid distribution at each position is plotted as a red histogram. (Note that not all divergent positions are pattern positions used in mcBPPS partitioning—for example, the ‘W’ in the F-helix). Residues in the alignment are highlighted based on chemical similarity. Secondary structural elements are indicated above the alignment, and three previously unidentified PTK-conserved positions are numbered based on the human EphA3 sequence (Uniprot P29320). The regions for each PTK sequence in the display alignment are also numbered, with the corresponding Uniprot ID given next to the PTK name. The STK-histidine that is selectively lost in PTKs is highlighted in the alignment with a red rectangle. The R-spine aspartate (R-Spine-Asp) conserved in all eukaryotic protein kinases is highlighted in gray.

