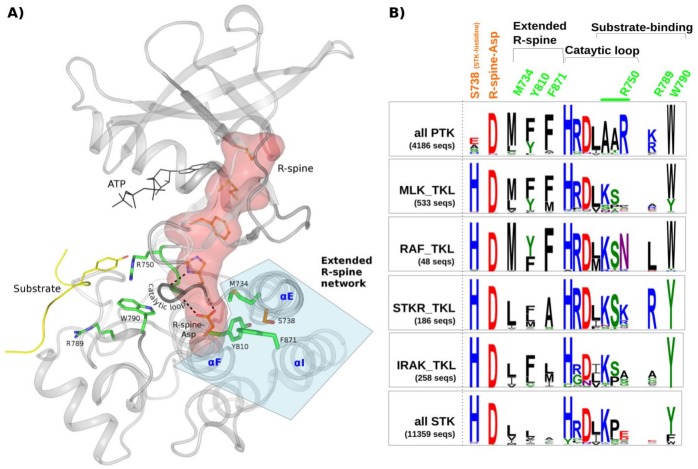
Fig 2. Structural location and comparisons of PTK-conserved residues in PTKs, STKs and TKLs.
A) Key PTK-conserved residues are mapped to human EphA3 crystal structure (PDB: 3fy2) and shown in green. The extended R-spine residues are shown in stick representation and highlighted as a group in light blue. The residue at the STK-histidine position (S738) is shown in orange. The alpha helices where the substrate-binding residues are located are labeled in blue. Substrate-binding residues R750, R789, and W790 are also shown in stick representation. The substrate-binding ‘AAR’ motif of the catalytic loop is represented as the green portion of the catalytic loop, which spans the length of the small dotted lines. The R-spine is shown as a red surface representation, and key hydrogen bonds made by the F-helix-Asp and the HRD motif histidine are shown by large dotted lines. B) Comparative analysis of PTK-conserved patterns in PTKs, TKLs and STKs. PTK-conserved positions are indicated in green. Weblogos show the relative frequencies of residues at PTK-conserved positions in PTKs, selected TKL families, and STKs from Metazoan genomes (number of sequences indicated in the figure). The residues are numbered according to EphA3 numbering. The height of a character in each logo is proportional to its conservation in that group.

