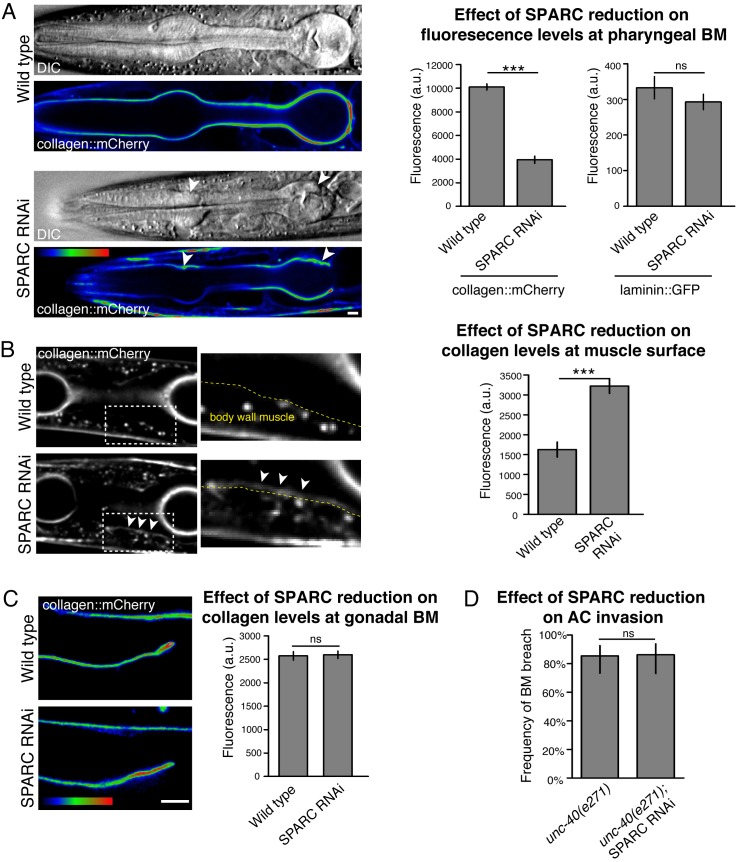
Fig 6. SPARC regulates the transport of type IV collagen during development.
(A) DIC images and corresponding spectral representations of fluorescence intensity showing collagen::mCherry in the pharyngeal BM of a wild type animal (top panel) and SPARC RNAi-treated animal (bottom). Arrowheads indicate BM deformations after SPARC reduction. The average collagen::mCherry and laminin::GFP fluorescence levels at the pharyngeal BM in wild type and SPARC RNAi-treated animals are quantified in the graph on the right and compared using a two-tailed unpaired Student’s t-test (n≥15 for each treatment; *** denotes p<0.0005 for collagen::mCherry; p = 0.3 for laminin::GFP; error bars show SEM). (B) Representative fluorescence images of collagen::mCherry in the Z-plane of body wall muscle cells in a wild type animal (top, see Fig 2 for the location of body wall muscles in cross section) and SPARC RNAi-treated animal (bottom). The boxed regions indicate body wall muscle cells and are magnified on the right with dashed lines representing the muscle surface as determined by corresponding DIC images. Collagen::mCherry accumulated abnormally at the muscle surface in the SPARC RNAi-treated animal (arrowheads), and was difficult to detect at the muscle surface in the wild type animal. The average collagen::mCherry fluorescence levels at the muscle surface (dashed yellow lines on left) are quantified in the graph on the right (n = 6 wild type and 12 RNAi treated animals). *** denotes p<0.0005 by two-tailed unpaired Student’s t-test; error bars show SEM. (C) Spectral representation of collagen::mCherry fluorescence intensity at the gonadal BM in wild type (top) and SPARC RNAi treated (bottom) representative animals. The average collagen::mCherry fluorescence levels are quantified in the graph on the right (n≥40 for each treatment; p = 0.8 by unpaired two-tailed Student’s t-test; error bars show SEM). (D) Graph depicts the frequency of ACs breaching the BM in unc-40(e271) animals treated with SPARC RNAi (n≥51 for each treatment; p = 1.0 by two-tailed Fisher’s exact test). Error bars show 95% confidence intervals with a continuity correction. Scale bars denote 5 μm.

