Figure 1.

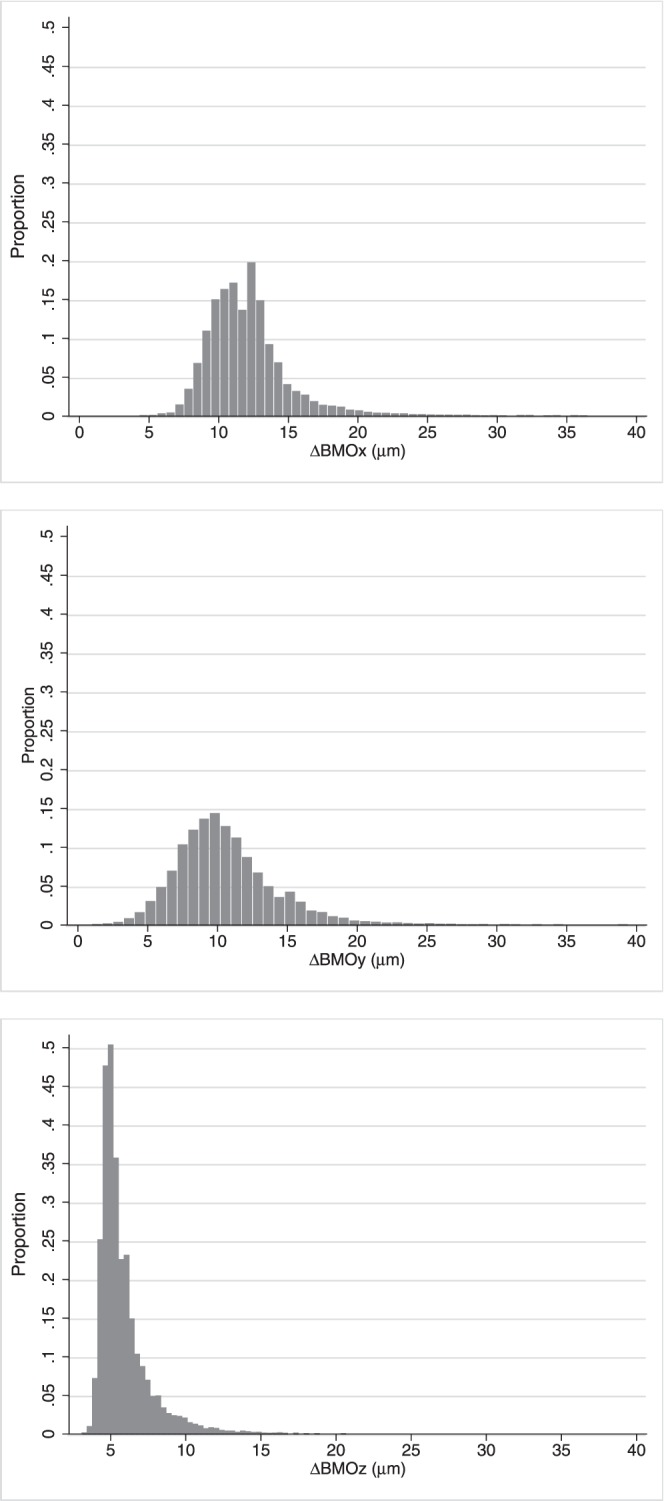
Distribution of the absolute value of the differences in micrometers between SALSA and manual BMO segmentation location for x-, y-, and z-axes (top to bottom, ΔBMOx, ΔBMOy, and ΔBMOz, respectively) using the 50 eyes of stable group.

Distribution of the absolute value of the differences in micrometers between SALSA and manual BMO segmentation location for x-, y-, and z-axes (top to bottom, ΔBMOx, ΔBMOy, and ΔBMOz, respectively) using the 50 eyes of stable group.