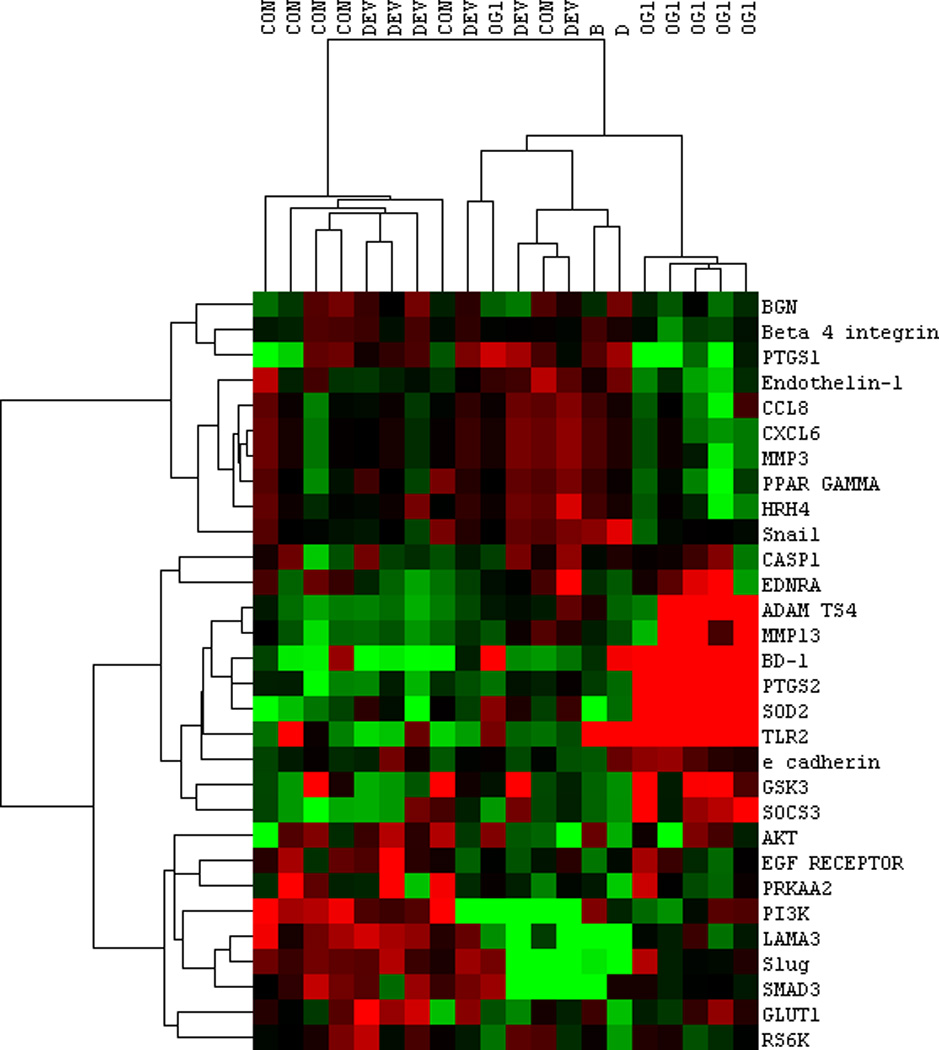
Fig 4.

Heat map of nanoString results comparing LBEC selected gene expressions from horses at the CON, DEV and OG1 time points. Red, green, and black colours represent high, low, and mean expression levels, respectively. Note the clustering of highly expressed genes from RNA-seq data at OG1 time point. Genes selected for evaluation were determined by the differential expression from 2 different studies, therefore not all genes present on this heat map were differentially expressed in this study alone. Samples B and D are not related to this study.
