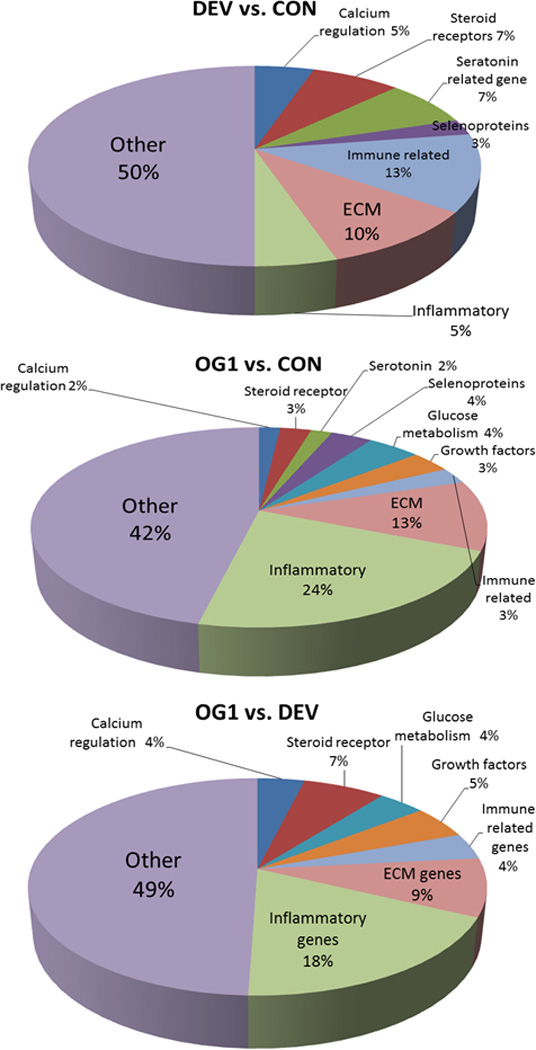
Fig 5.

Pie charts representing the percent of differentially expressed genes in each of the compared groups (DEV vs. CON; OG1 vs. CON; and OG1 vs. DEV). While expressed genes could cross multiple categories, each gene was only assigned to one category. Other genes could not be grouped with sufficient numbers to include as individual categories but all differentially expressed genes are demonstrated in Supplementary Items 1–3 for review.
