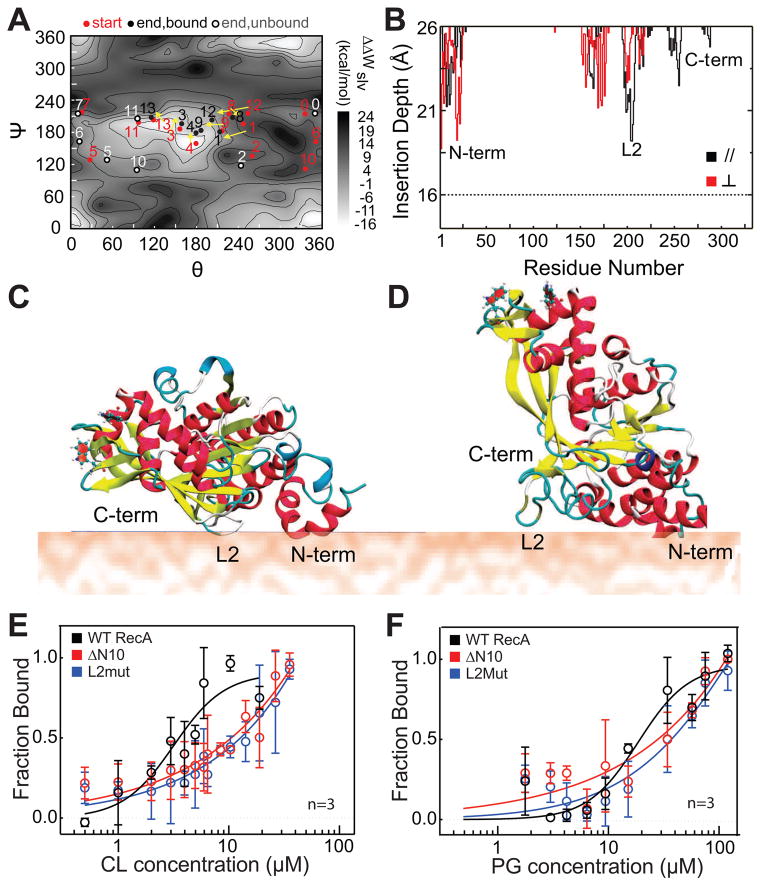
Figure 2. L2 and N10 regions form the binding interface of RecA with anionic PLs.
(A) 14 different trajectories are shown in dots (starting points are red, and ending points are black if RecA is bound and grey if RecA is unbound) on a solvation PMF (ΔWslv) scan map of the interaction energy between RecA and the membrane. Trajectories of RecA- bound to the membrane are connected with arrows. (B) A plot of the average insertion depth of RecA into the membrane calculated from the two typical binding trajectories observed. The insertion depth for the N-terminus, DNA binding loop L2, and C- terminus regions of RecA are labeled. (C) A cartoon depicting the structure of the membrane-bound orientation observed in trajectory 4 (shown in panel A), denoted as the parallel ‘//’ orientation. (D) A cartoon depicting the structure of the membrane- bound orientation observed in trajectory 13, denoted as the perpendicular ‘ ⊥ ‘ orientation. (E and F) Langmuir binding isotherms of N10 and L2 mutants of RecA compared to WT. The N10 and L2 regions of RecA are important for its interaction with PG and CL, and mutating these regions of RecA weakens its binding to anionic PLs. Error bars indicate SD. Also see Fig S1, Fig S2 and Table S1.

