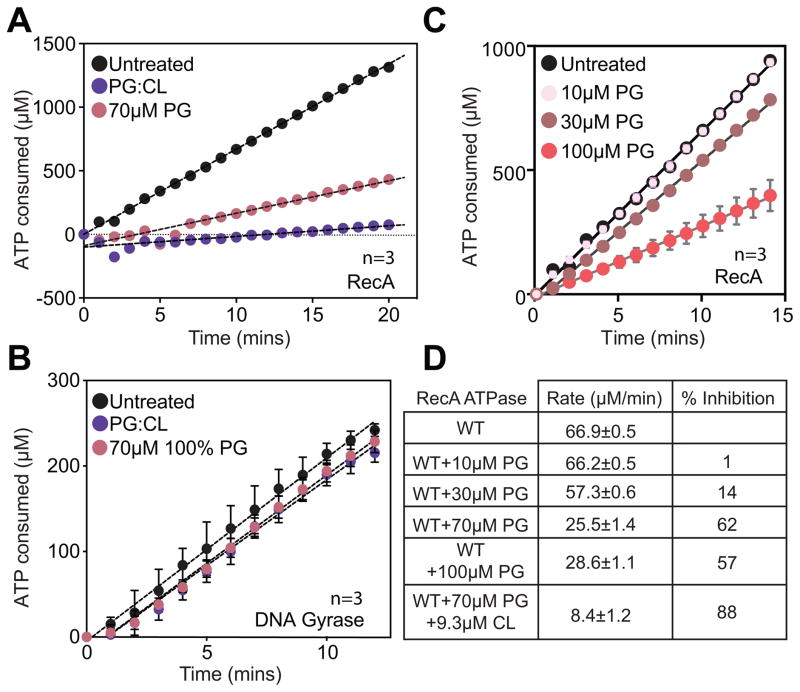
Figure 3. ATPase assays with aPLs for RecA and DNA Gyrase.
(A) Anionic PLs inhibit DNA dependent ATP hydrolysis by RecA. (B) Negative control with DNA gyrase DNA-dependent ATP hydrolysis indicates that the inhibition of RecA ATP hydrolysis is due to a specific interaction of anionic PLs with RecA. (C) Titration of PG liposomes show that ATPase rates are inhibited as a function of concentration of PG. (D) Absolute ATPase rates calculated from fits to the curves above. Error bars indicate SD. Also see Fig S3.

