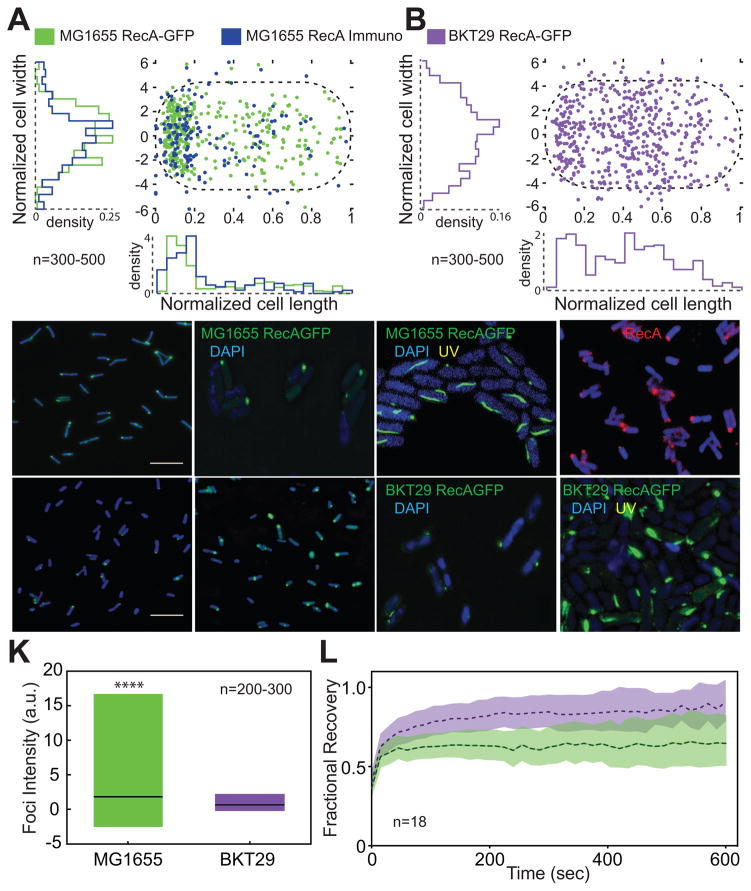
Figure 4. RecA foci localize to the poles of E. coli and mislocalize in the absence of anionic PLs.
(A) Quantification of the position of RecA in WT cells using RecA-GFP and immunofluorescence labeling. (B) RecA-GFP foci mislocalize in the absence of aPLs (strain BKT29). (C) Representative image of RecA-GFP in WT cells (cells are false colored blue). (D) 3D-SIM images show that RecA foci are located on the periphery of the nucleoid (visualized in blue by DAPI staining) in WT. (E) We observe the formation of RecA filament bundles following UV treatment that were positioned proximal to the nucleoid. (F) A representative image of immunofluorescence of RecA in WT cells. (G and H) Representative images of RecA-GFP foci in BKT29 using epifluorescence microscopy (cells are false colored blue) and (I) 3D-SIM with DAPI. (J) Images of UV-treated BKT29 cells using 3D-SIM and labeled with DAPI demonstrating short, ellipsoidal filament bundles. (K) BKT29 cells have foci that display a significantly lower fluorescence intensity compared to WT. Plot displays distribution of foci intensity from min to max, with black line indicating mean. **** Indicates p<0.001 calculated using a two-tailed t-test. (L) FRAP recovery curves for RecA-GFP foci for WT and BKT29. Shaded area indicates 95% confidence intervals. BKT29 displays a larger mobile fraction of RecA compared to WT, indicating a higher turnover rate of protein within the foci. This result indicates that anionic PLs have a stabilizing effect on RecA within the cell. Also see Fig S4, S5 and S7.

