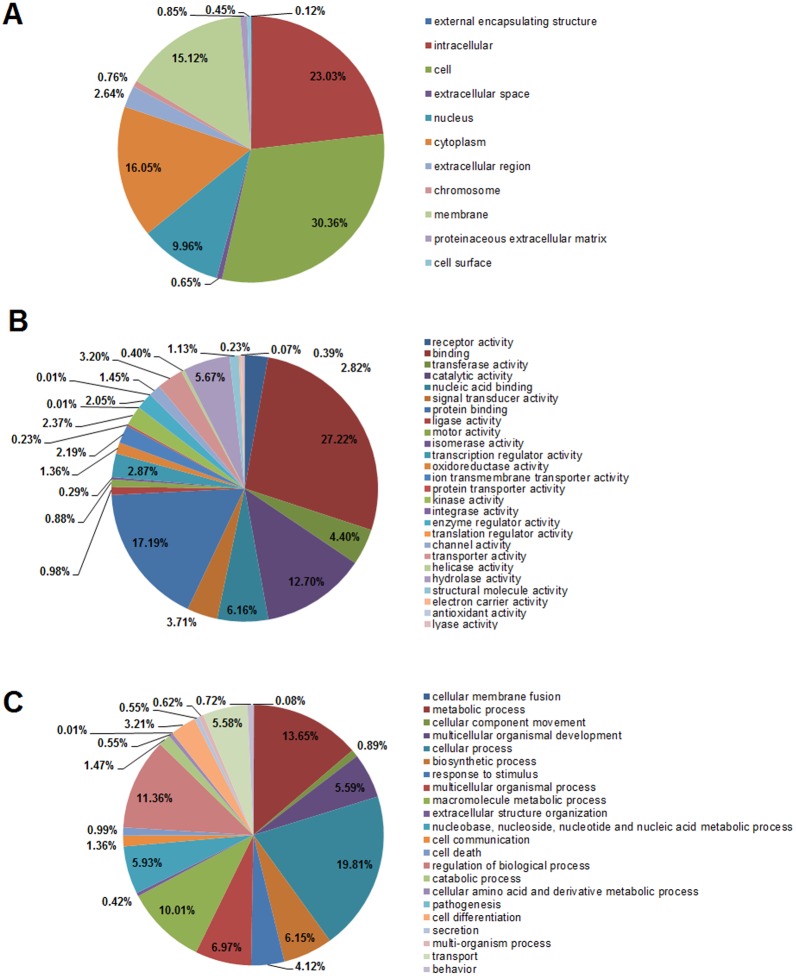
Fig 4. Distribution of Gene Ontology (GO) functional categories (level 2) of transcripts for S. maximus.
(A) Cellular component; (B) Molecular function; (C) Biological process. Each annotated sequence is assigned at least one GO term. Numbers refer to percentage of assigned unigenes in each category.

