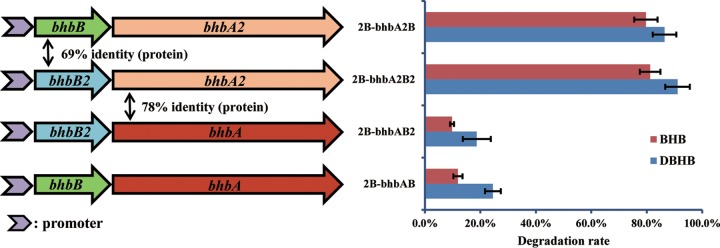
FIG 6.
Diagram of the combinations of the extracytoplasmic binding receptor gene (bhbB/B2) and the reductive dehalogenase gene (bhbA/bhbA2) (left) and the degradation rates of DBHB and BHB by strain 2B carrying pMCSQ2-bhbAB, pMCSQ2-bhbAB2, pMCSQ2-bhbA2B, or pMCSQ2-bhbA2B2 (right). The data are presented as the means ± standard deviations for triplicate incubations. When the error bar is not visible, it is within the data point.

