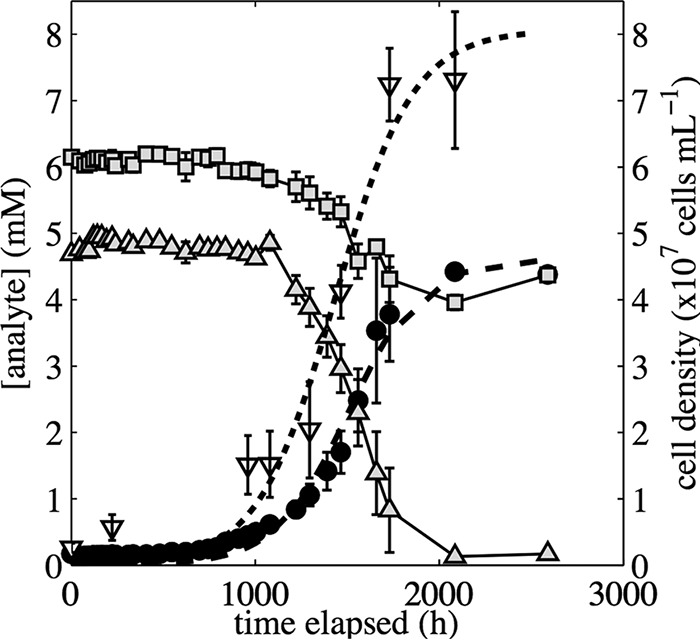
FIG 4.

Concentrations of SO42− (●), S2O32− (■), and NO2− (▲) and cell density (▽) during the growth of Thiobacillus sp. RG5 when it was incubated at 5.1°C with S2O32− provided as the electron donor and NO2− provided as the electron acceptor. Values represent the average from triplicate biotic assays. Error bars are 1σ. Dashed line and dotted lines show the best-fit logistic model describing SO42− production and cell formation data, respectively.
